- English
- Español
- Português
- русский
- Français
- 日本語
- Deutsch
- tiếng Việt
- Italiano
- Nederlands
- ภาษาไทย
- Polski
- 한국어
- Svenska
- magyar
- Malay
- বাংলা ভাষার
- Dansk
- Suomi
- हिन्दी
- Pilipino
- Türkçe
- Gaeilge
- العربية
- Indonesia
- Norsk
- تمل
- český
- ελληνικά
- український
- Javanese
- فارسی
- தமிழ்
- తెలుగు
- नेपाली
- Burmese
- български
- ລາວ
- Latine
- Қазақша
- Euskal
- Azərbaycan
- Slovenský jazyk
- Македонски
- Lietuvos
- Eesti Keel
- Română
- Slovenski
- मराठी
- Srpski језик


How to read battery discharge curve
How to read battery discharge curve
Batteries are complex electrochemical and thermodynamic systems, and multiple factors affect their performance. Of course, battery chemistry is the most important factor. However, when understanding which type of battery is most suitable for a specific application, it is also necessary to consider factors such as charge discharge rate, operating temperature, storage conditions, and physical structure details. Firstly, several terms need to be defined:
★ Open circuit voltage (Voc) is the voltage between the battery terminals when there is no load on the battery.
★ Terminal voltage (Vt) is the voltage between the battery terminals when the load is applied to the battery; Usually lower than Voc.
The cut-off voltage (Vco) is the voltage at which the battery is fully discharged, as specified. Although there is usually remaining battery power, operating at a voltage below Vco may damage the battery.
★ Capacity measures the total ampere hours (AH) that a battery can provide when fully charged, until Vt reaches Vco.
The charge discharge rate (C-Rate) is the rate at which a battery is charged or discharged relative to its rated capacity. For example, a rate of 1C will fully charge or discharge the battery within 1 hour. At a discharge rate of 0.5C, the battery will fully discharge within 2 hours. Using a higher C-Rate usually reduces the available battery capacity and may damage the battery.
★ The battery charging state (SoC) quantifies the remaining battery capacity as a percentage of the maximum capacity. When SoC reaches zero and Vt reaches Vco, there may still be remaining battery power in the battery, but without damaging the battery and affecting future capacity, the battery cannot be further discharged.
★ Discharge depth (DoD) is a complement of SoC, which measures the percentage of battery capacity that has been discharged; DoD=100- SoC.
① The cycle life is the number of available cycles before the battery reaches its end of service life.
End of battery life (EoL) refers to the inability of the battery to operate according to the predetermined minimum specifications. EoL can be quantified in various ways:
① Capacity decay is based on the given percentage decrease in battery capacity compared to rated capacity under specified conditions.
② Power attenuation is based on the maximum power of the battery at a given percentage compared to the rated power under specified conditions.
③ The energy throughput quantifies the total amount of energy that a battery is expected to process during its lifespan, such as 30MWh, based on specific operating conditions.
★ The health status (SoH) of the battery measures the percentage of useful life remaining before reaching EoL.
Polarization curve
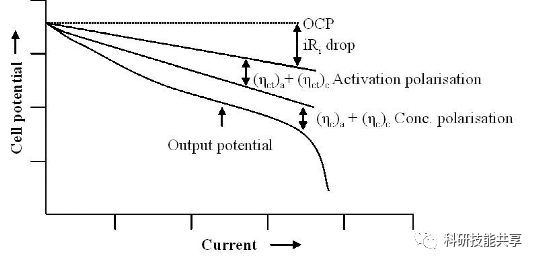
The battery discharge curve is formed based on the polarization effect of the battery that occurs during the discharge process. The amount of energy that a battery can provide under different operating conditions, such as C-rate and operating temperature, is closely related to the area under the discharge curve. During the discharge process, the Vt of the battery will decrease. The decrease in Vt is related to several main factors:
✔ IR drop - The decrease in battery voltage caused by the current passing through the internal resistance of the battery. This factor increases linearly at a relatively high discharge rate, with a constant temperature.
✔ Activation polarization - refers to various deceleration factors related to the kinetics of electrochemical reactions, such as the work function that ions must overcome at the junction between electrodes and electrolytes.
✔ Concentration polarization - This factor takes into account the resistance faced by ions during mass transfer (diffusion) from one electrode to another. This factor dominates when lithium-ion batteries are fully discharged, and the slope of the curve becomes very steep.
Discharge curve considerations
Batteries have been designed for a wide range of applications and provide various performance characteristics. For example, there are at least six basic lithium ion chemical systems, each with its own unique feature set. The discharge curve is usually plotted with Vt on the Y-axis, while SoC (or DoD) is plotted on the X-axis. Due to the correlation between battery performance and various parameters such as C-rate and operating temperature, each battery chemical system has a series of discharge curves based on specific operating parameter combinations. For example, the following figure compares the discharge performance of two common lithium-ion chemical systems and lead-acid batteries at room temperature and 0.2C discharge rate. The shape of the discharge curve is of great significance to designers.
A flat discharge curve can simplify certain application designs, as the battery voltage remains relatively stable throughout the entire discharge cycle. On the other hand, the slope curve can simplify the estimation of residual charge, as the battery voltage is closely related to the residual charge in the battery. However, for lithium-ion batteries with flat discharge curves, estimating residual charge requires more complex methods, such as Coulomb counting, which measures the discharge current of the battery and integrates the current over time to estimate residual charge.
In addition, batteries with downward sloping discharge curves experience a decrease in power throughout the entire discharge cycle. An 'excess size' battery may be required to support high-power applications at the end of the discharge cycle. It is usually necessary to use a boost voltage regulator to power sensitive devices and systems using batteries with steep discharge curves.
The following is the discharge curve of a lithium-ion battery, which shows that if the battery is discharged at a very high rate (or vice versa, at a low rate), the effective capacity will decrease (or increase). This is called capacity shift, and this effect is common in most battery chemistry systems.
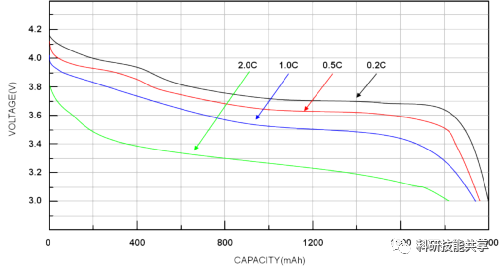
The voltage and capacity of lithium-ion batteries decrease with the increase of C rate. (Image: Richtek)
Working temperature is an important parameter that affects battery performance. At very low temperatures, batteries with water-based electrolytes may freeze, limiting the lower limit of their operating temperature range. Lithium ion batteries can experience negative electrode lithium deposition at low temperatures, permanently reducing capacity. At high temperatures, chemicals may decompose and the battery may stop working. Between freezing and chemical damage, battery performance typically varies significantly with temperature changes.
The following figure shows the impact of different temperatures on the performance of lithium-ion batteries. At very low temperatures, performance may significantly decrease. However, the battery discharge curve is only one aspect of battery performance. For example, the greater the deviation between the operating temperature of lithium-ion batteries and room temperature (whether at high or low temperatures), the lower the cycle life. For specific applications, a complete analysis of all factors affecting the applicability of various battery chemical systems is beyond the scope of this article's battery discharge curve. An example of other methods for analyzing the performance of different batteries is the Lagone plot.
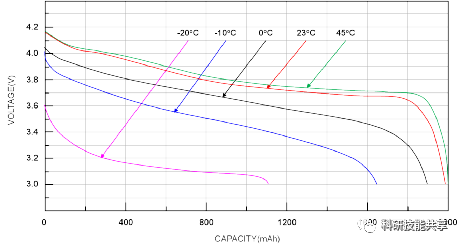
The battery voltage and capacity depend on temperature. (Image: Richtek)
Lagone plots
The Lagoon diagram compares the specific power and specific energy of different energy storage technologies. For example, when considering electric vehicle batteries, specific energy is related to range, while specific power corresponds to acceleration performance.

The Lagoon diagram is based on mass energy density and power density, and does not include any information related to volume parameters. Although metallurgist David V. Lagone developed these charts to compare the performance of various battery chemistry, the Lagone chart is also suitable for comparing any set of energy storage and energy devices, such as engines, gas turbines, and fuel cells.
The ratio between the specific energy on the Y-axis and the specific power on the X-axis is the number of hours the device operates at rated power. The size of the device does not affect this relationship, as larger devices will have proportionally higher power and energy capacity. The isochronous curve representing constant operating time on the Lagoon diagram is a straight line.
Summary
It is important to understand the discharge curve of a battery and the various parameters that make up the discharge curve family related to specific battery chemistry. Due to the complex electrochemical and thermodynamic systems, the discharge curves of batteries are also complex, but they are only a way to understand the performance trade-offs between various battery chemistry and structures.